DID YOU KNOW?
30‑40%
Avg. increase in efficiency by implementing effective PRC
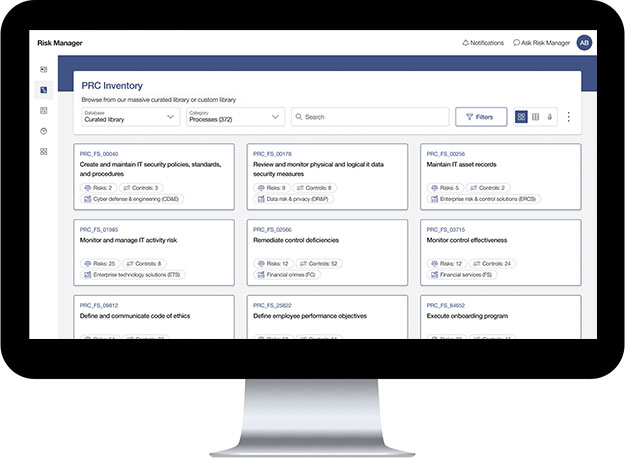
A Cloud-based application that harnesses Generative AI to help clients navigate the complexities of Process Risk and Controls (PRC), reduce risk and manage business processes.
Managing, maintaining, and creating Process Risk and Controls (PRC) is crucial for any business, but can be incredibly overwhelming and laborious.
To provide users with a way to easily create, manage, and modify PRC's using the power of Generative AI.
Lead User Experience Designer
Team lead during the design process: wireframing, prototyping, usability studies, and design mock-ups.
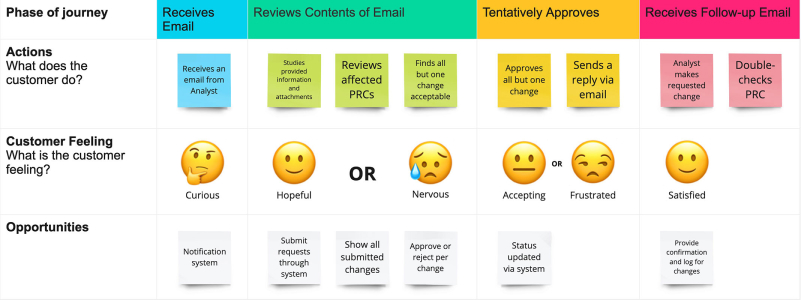
The team and I conducted interviews and created empathy maps to understand our users and their needs. A primary user group of potential power users emerged through our research: entry-level Process Risk Analysts responsible for the day-to-day maintenance of a Process framework.
Risk Managers who manage a team of analysts were established as a secondary user group. Responsible for all PRC-related decisions, they must ultimately review and approve all changes made by their staff.
Without high-level discipline and organizational skills, our users are at risk to underperform, cost their organization, or lose their jobs.
Industries like finance and healthcare face strict regulations that require scrutinous risk management and control frameworks. Non-compliance could lead to significant penalties.
PRC frameworks need ongoing assessment and improvements, utilizing audits to refine processes and controls
Avg. increase in efficiency by implementing effective PRC

My job is all about the details... and there are A LOT of them.
Priya is a 26-year-old Process Risk Analyst responsible for identifying, assessing, and mitigating risks associated with business processes. Her primary focus is ensuring that processes are efficient, compliant, and capable of achieving organizational objectives while minimizing potential risks.
Hometown: Chicago, Illinois
Family: Spouse
Primary Task: Modify a PRC and submit the change for approval.


I make sure my detail-oriented team performs efficiently.
Jonathan is a 38-year-old Risk Manager with extensive experience in Process Risk Controls (PRC). He is an expert on the topic and has used various tools to expedite his workflow, but he always seems to resort back to tried-and-true methods because of inaccuracies. He manages a team of Process Risk Analysts, including Priya.
Hometown: Dallas, Texas
Family: Spouse, 2 Children
Primary Task: Review and approve a PRC change submitted by a member of his team.
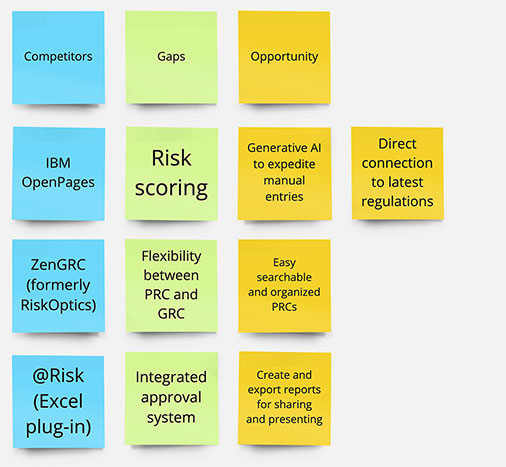
My team and I assembled an affinity map to organize the results of our competitive analysis into gaps left by the competition and opportunities presented by these gaps.
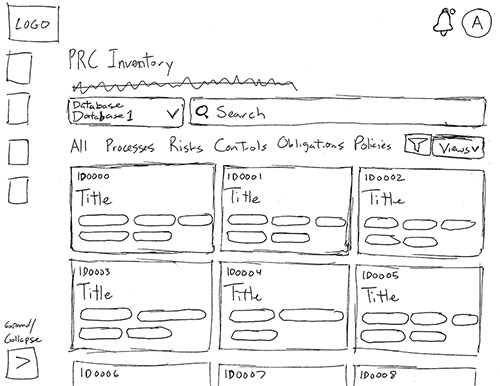
With the research complete and opportunities identified, it was time to start sketching screens. The step is crucial when it comes to the hierarchy of data and the utilization of specific charts and form components. Since the proposed application would be accessing classified data on secured laptop and desktop machines via a browser, desktop screen sizes were deemed an ideal place to start.
Main Dashboard: Card View
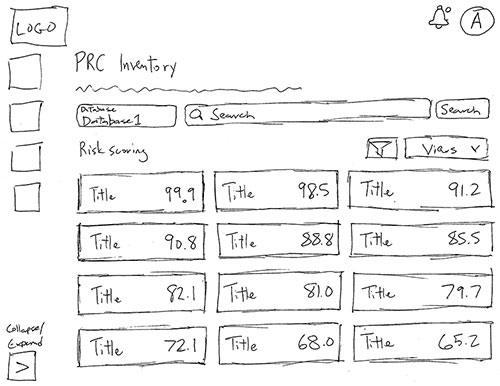
Risk Scoring
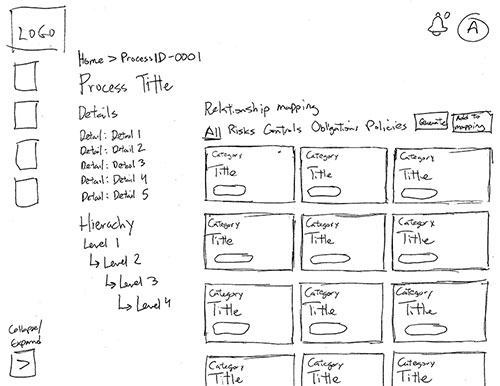
Process Details
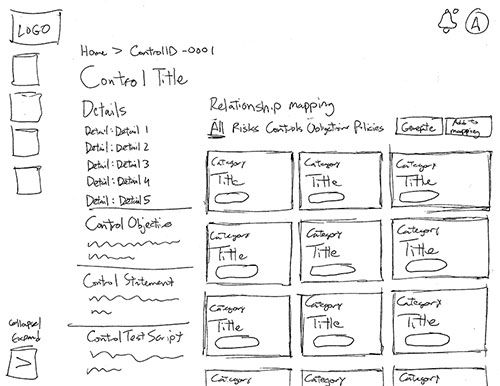
Control Details
The team and I continued to ideate our sketches until they were approved by our stakeholders and subject matter experts. The various iterations of the sketches helped us solidify a favorable, curated format for our dashboards. The next step was to create some wireframes that would follow Priya’s primary task of changing a PRC and sending it to Jonathan for approval.
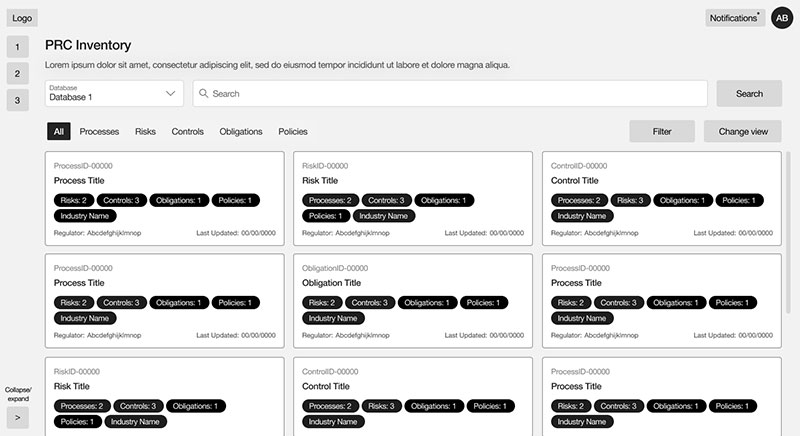
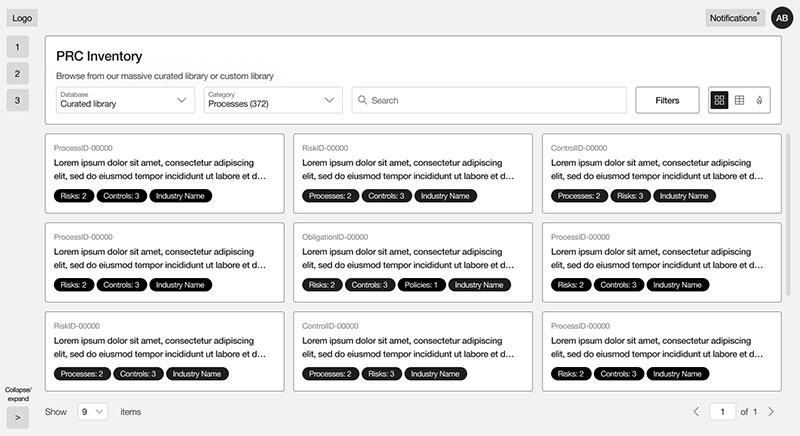
Main Dashboard: Card View
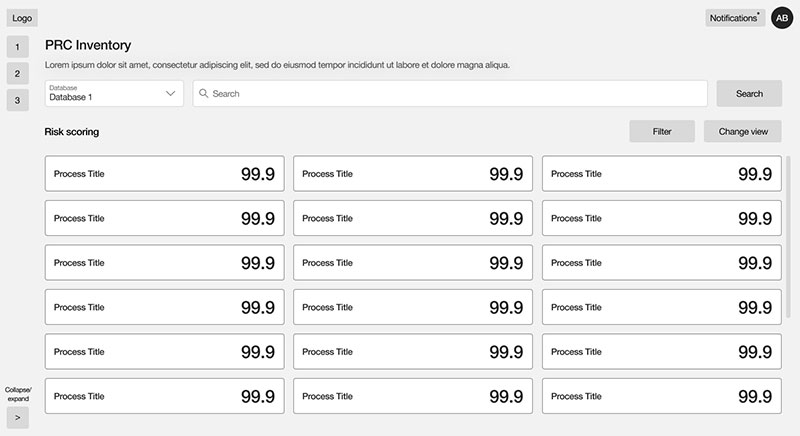
Main Dashboard: Risk Scoring
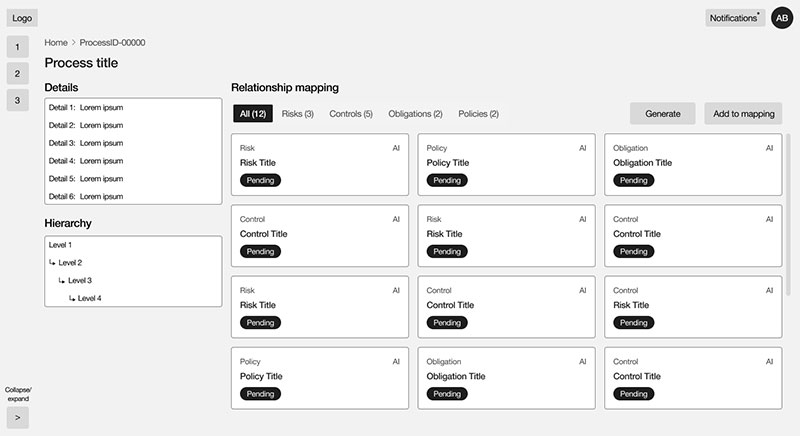
Process Details
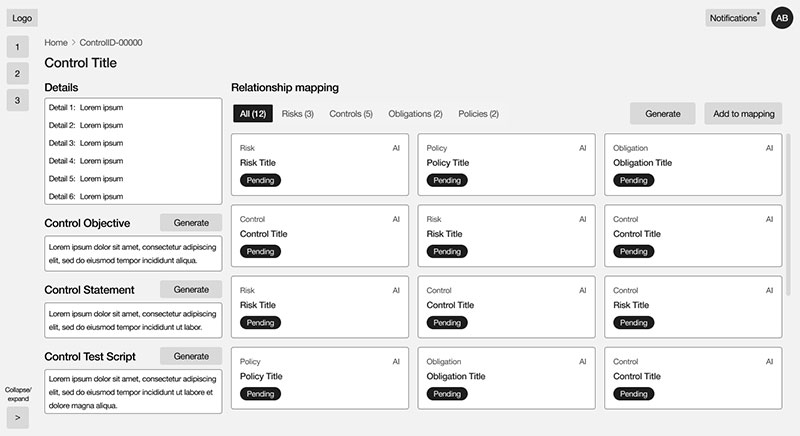
Control Details
Once the wireframes were completed, we put together a low-fidelity prototype that demonstrates a Process Risk Analyst’s journey to find, select, and adjust a Process Risk Control. This prototype would serve as a testing ground for our usability study.

The team and I conducted several moderated live usability studies with stakeholders and subject matter experts fully versed in Process Risk Controls (PRC). We found the most effective method was to use Microsoft Teams to connect with our testers, conduct our interviews, and record their interactions with the prototype. Ultimately, we interviewed and observed 10 participants and spent close to an hour on each session.
We asked all of our testers to find a Control, update the Control Objective, Control Statement, and Control Test Script, and submit it for approval.
After wrapping up our interviews and observations, we compiled all of the data and found although all testers completed their task, we had quite a few adjustments to make:
Sometimes designs don’t align with the expectations of the testers. Fortunately, their feedback about what is not working is incredibly impactful and always moves the team closer to a better product. Our testers gave us a lot to consider:
The cards and tables displayed in our search results were overloaded with unnecessary details. We collaborated with PRC experts to reduce the information within the cards to only essential information as details are only one click away on a details page.
BONUS: We discovered that the crucial data varied so significantly that it became impossible to display them under an "All" tab. This led us to remove the tabs altogether and add a dropdown next to the search input to streamline the search process.

Testers found the Risk scoring concept intriguing, but confusing. The scoring system associated high scores with high risk, which ran contradictory to most scoring systems where high scores are positive. Our solution was to flip it upside down and rebrand it as a Confidence Score with higher scores indicating more confidence in that PRC.
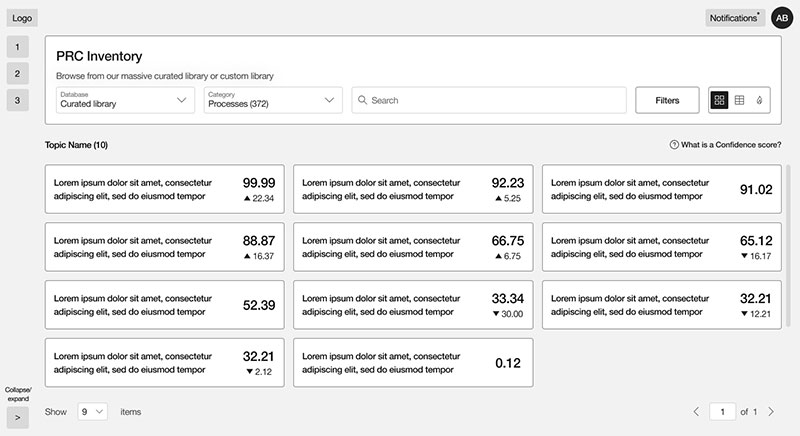
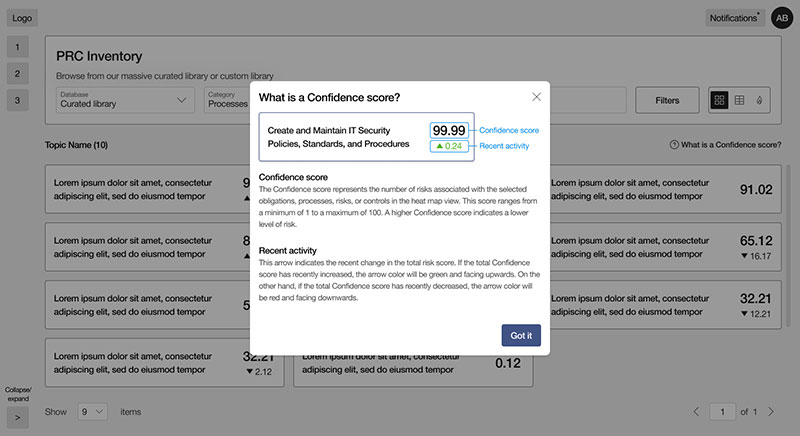
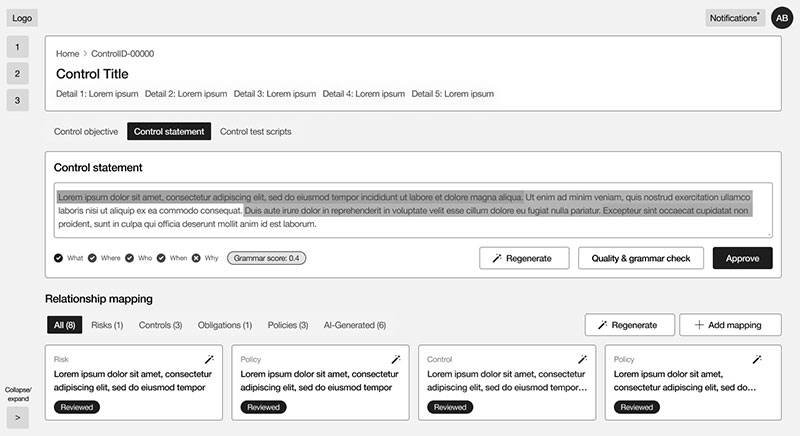
In the original layout, a left column was reserved for details, statements, and objectives, but we soon discovered that these were so important that they needed to be prioritized in the hierarchy. We created a series of complementary components and moved them to a premier position in the layout.
BONUS: Detail pages for Processes, Risks, and Controls needed to add and remove certain components depending on a variety of factors. Our solution was to design full width components that could easily be added or removed without affecting the layout at all.

After improving the designs based on the feedback we received from our testers, we received unanimous praise and approval from our stakeholders for our improvements. The next step was to make our dashboards come to life with a round of mock-ups.
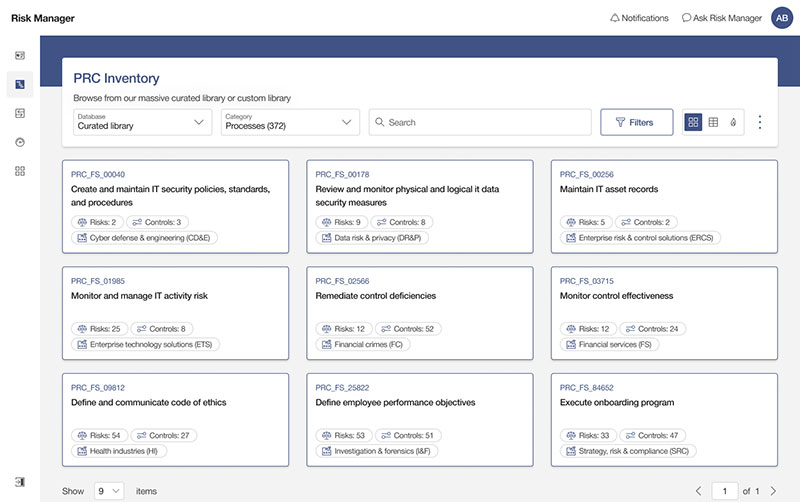
Main Dashboard: Card View
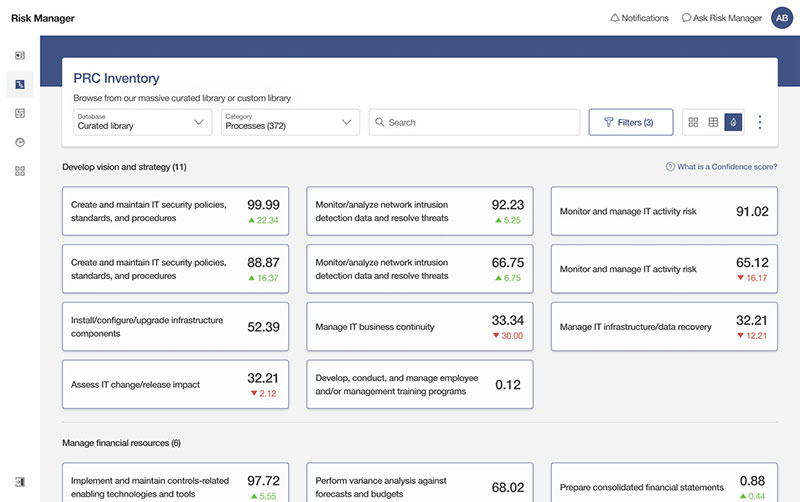
Main Dashboard: Confidence Scores
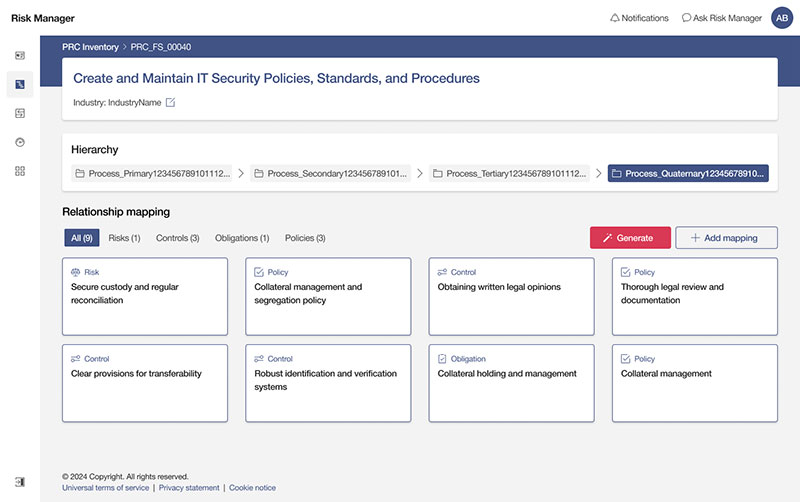
Process Details
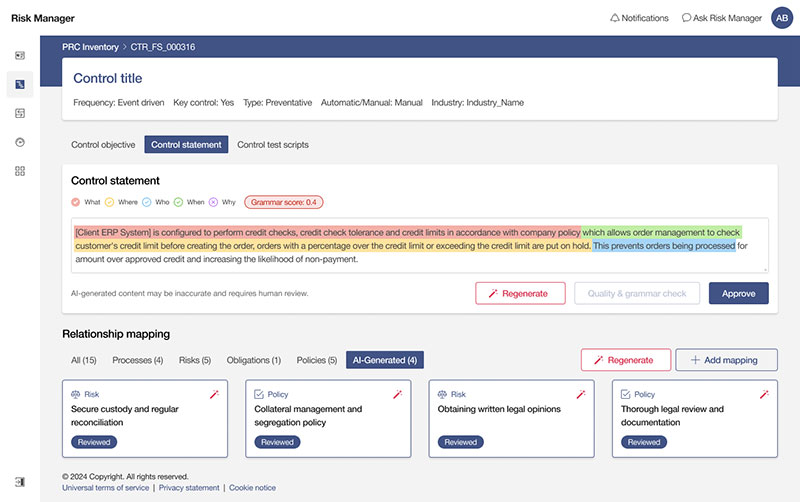
Control Details
The final step before handing off our designs to the development team was to take our high-fidelity mock-ups and create a working prototype, which would be an integral part of future presentations, help us verify the final details with testers, and serve as a visual template for the developers to emulate.
