Profit Prophet
Find the right price in seconds — one that balances profit and value.
Product, client, and persona names have been changed for confidentiality.
There’s a best price for every product. Most teams never find it.
The Research
Process
Empathy Map
 An empathy map helps us establish our personas by finding their voices, feelings, and motivations.
Empathy map of our target user, in four quadrants:
- Says
- “It’s impossible to predict the impact of price changes with my resources.”
- “We have the data, but it takes so long to organize it in any meaningful way.”
- Thinks
- I’ve heard this pitch before. Even the latest tools I have don’t cut it.
- I wish pricing data were actively helping me make smarter decisions based on industry trends.
- Does
- Relies on basic tools to “get the job done.”
- Tries to make data-driven decisions, but they’re more like educated guesses.
- Spends too much time assisting team members.
- Feels
- Overwhelmed
- Unsure
- Rushed
- Not fully confident about pricing decisions
User Pain Points
1. Monitoring price performance
Product teams may be unable to monitor price performance of their products, which restricts their ability to identify the right product mix and explore drivers for low‑performing products.
2. Data-driven pricing decisions
Pricing teams may not have the right skills or capabilities to make smart, data‑driven pricing decisions.
3. Revenue growth vs. profitability
Leadership struggles with the trade‑off between revenue growth and profitability.
Our Users
Steven, Pricing Lead

“Half my week is spreadsheets and gut checks. I need to know a price is right before I commit to it, not after.”
Steven Brown is responsible for setting pricing strategies that maximize value and align with corporate objectives. His team regularly handles price adjustment requests from Sales.
Goals
- Efficiently handle pricing escalations and price adjustment requests
- Provide pricing team with the proper resources for pricing strategies
Frustrations
- Difficulty determining how pricing decisions will affect the market
- Available systems and tools are insufficient
Steven’s User Journey
Primary task: Find an optimal price for a product after a price adjustment request.
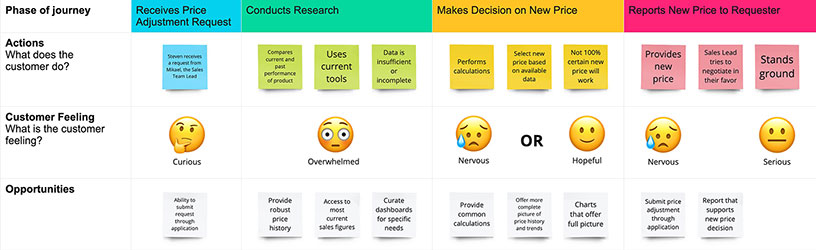
The journey has 4 phases. For each one: what the user does, how they feel, and the design opportunities it points to.
Phase 1: Receives Price Adjustment Request
- Actions
- Steven receives a request from Michael, the Sales Team Lead
- Feeling
- Curious
- Opportunities
- Ability to submit request through application
Phase 2: Conducts Research
- Actions
- Compares current and past performance of product
- Uses current tools
- Data is insufficient or incomplete
- Feeling
- Overwhelmed
- Opportunities
- Provide robust price history
- Access to most current sales figures
- Curate dashboards for specific needs
Phase 3: Makes Decision on New Price
- Actions
- Performs calculations
- Selects new price based on available data
- Not 100% certain new price will work
- Feeling
- Nervous or hopeful
- Opportunities
- Provide common calculations
- Offer more complete picture of price history and trends
- Charts that offer full picture
Phase 4: Reports New Price to Requester
- Actions
- Provides new price
- Sales Lead tries to negotiate in their favor
- Stands ground
- Feeling
- Nervous, then serious
- Opportunities
- Submit price adjustment through application
- Report that supports new price decision
Michael, Sales Team Lead

“When a deal stalls on price, I can’t wait three days for an answer from Pricing. I need to move fast.”
Michael Libera has strong business acumen and is constantly negotiating deals alongside his team. He regularly requests price adjustments from Steven in order to move more product.
Goals
- Work with Pricing Leads to optimize price points and profits
- Understand historical purchasing patterns of customers
Frustrations
- Can’t make data-driven decisions without the proper tools
- Many price escalations become short‑term solutions
Michael’s User Journey
Primary task: Make a price adjustment to a product.

The journey has 5 phases. For each one: what the user does, how they feel, and the design opportunities it points to.
Phase 1: Notices Drop in Sales of Product
- Actions
- Team member reports drop in sales
- Michael investigates latest sales figures
- Determines there must be a price adjustment
- Feeling
- Curious or intrigued
- Opportunities
- Curate dashboard for Sales Team
- System should flag downtrends
- Show how company sales compare to industry
Phase 2: Makes Price Adjustment Request
- Actions
- Emails or calls Pricing Lead
- Formally requests price adjustment
- Provides supporting data
- Feeling
- Hopeful
- Opportunities
- Submit requests through system
- Detailed report to be submitted with request
Phase 3: Receives New Price
- Actions
- Meets with Pricing Lead
- Gets new price but it isn’t ideal
- Feeling
- Disappointed
- Opportunities
- Provided through system
Phase 4: Tries to Negotiate “Better” Price
- Actions
- Tries to get Pricing Lead to provide more favorable price
- Asks for supporting evidence
- Feeling
- Nervous or frustrated
- Opportunities
- Ability to challenge price
- Provide report supporting decision
Phase 5: Accepts New Price
- Actions
- Pricing Lead ultimately makes the final decision
- Feeling
- Accepting
The Story
To understand what to design, we illustrated a typical interaction between Michael, Sales Team Lead, and Steven, Pricing Lead.
Ideate: Exploring Opportunities
My team and I assembled an affinity map to organize the results of our competitive analysis into gaps left by the competition and opportunities presented by these gaps.
Affinity Map
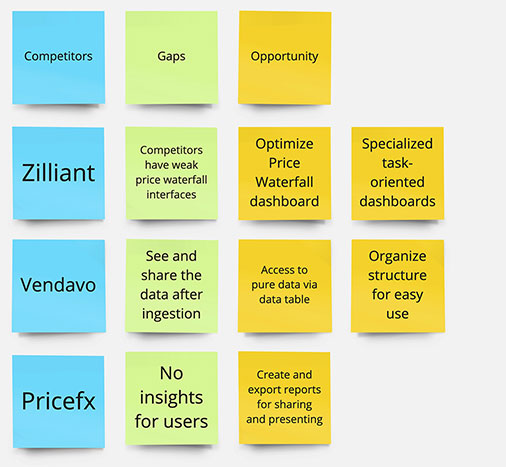 An affinity map is a great way to organize the results of the competitive analysis into opportunities left by the competition.
Sticky notes sorted into three columns: the competitors we analyzed, the gaps we found in their products, and the opportunities those gaps opened up.
- Competitors
- Zilliant
- Vendavo
- Pricefx
- Gaps
- Competitors have weak price waterfall interfaces
- See and share the data after ingestion
- No insights for users
- Opportunities
- Optimize Price Waterfall dashboard
- Specialized task-oriented dashboards
- Access to pure data via data table
- Organize structure for easy use
- Create and export reports for sharing and presenting
Top Opportunities
1. Robust Price Waterfall chart
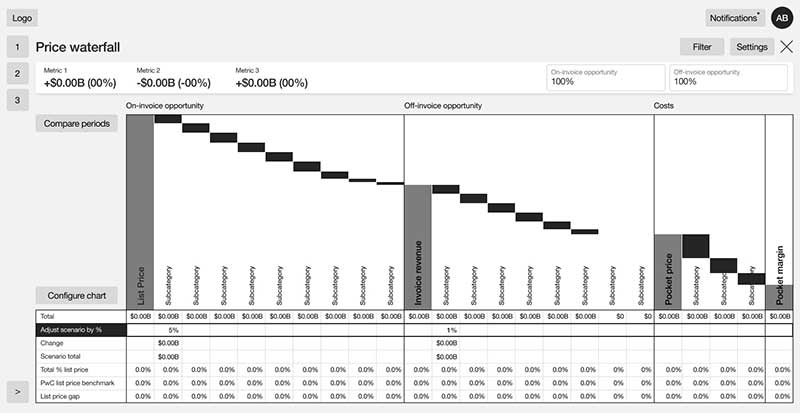
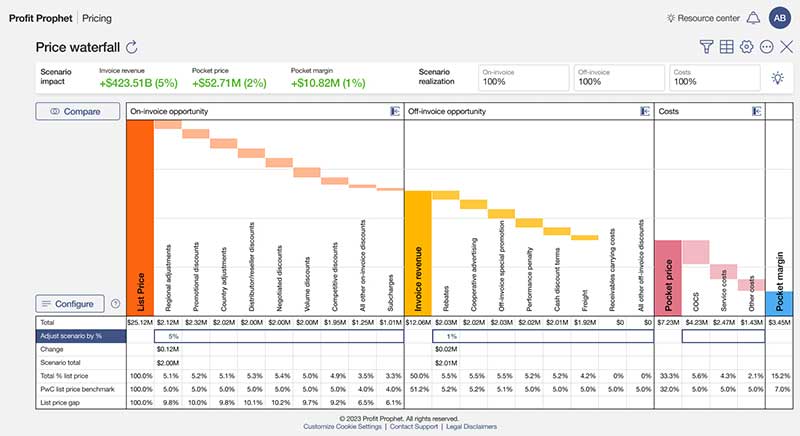
An interactive chart that allows users to make hypothetical price adjustments and see their effects in real time
2. Direct access to ingested data
Give users a direct line to the underlying data, instead of routing every question through a report request
3. Task‑oriented dashboards
Dashboards built around what each role actually needs to do, not a one-size-fits-all view of every metric
4. Create reports for sharing or presentation
Turn any dashboard view into a polished report ready to share with stakeholders
From Ideas to Sketches to Wireframes
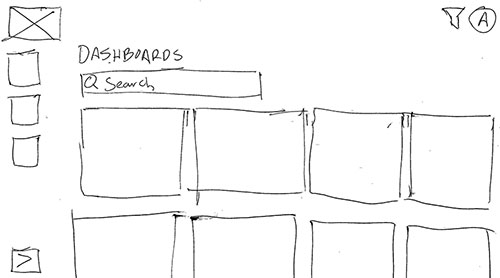
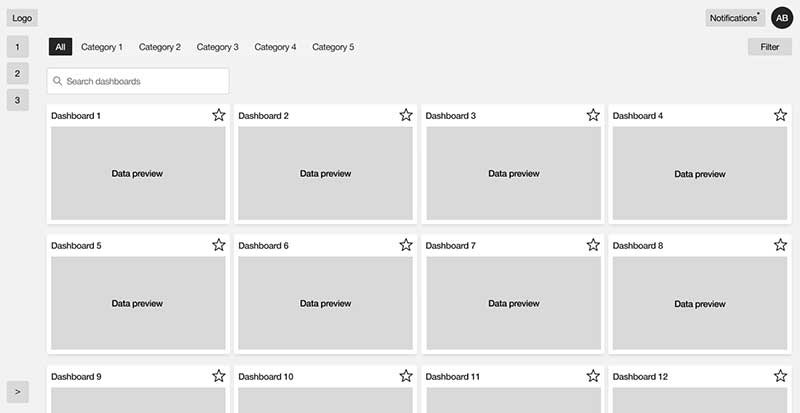
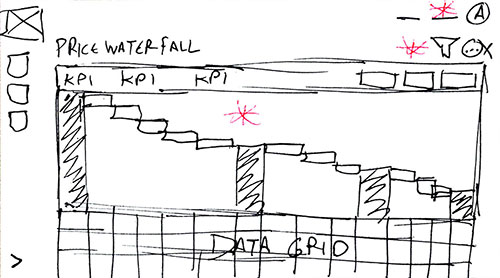
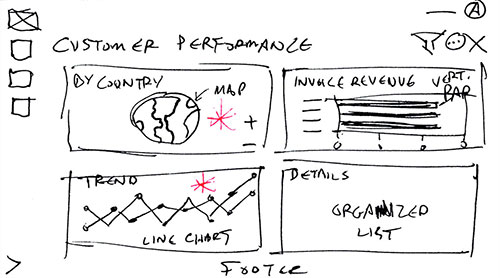
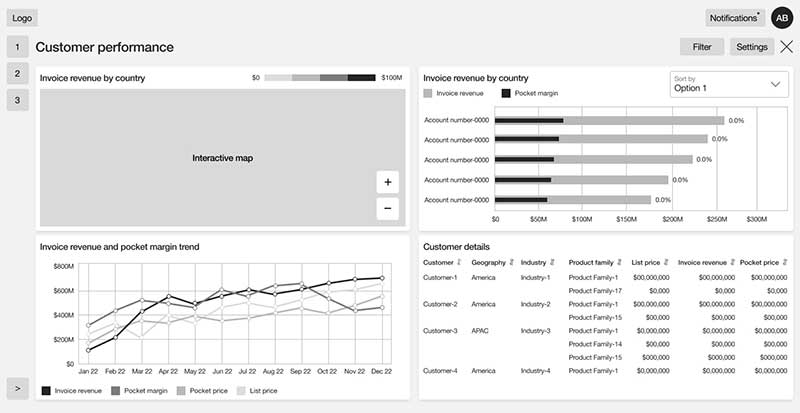
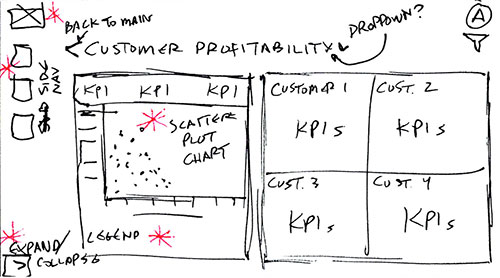
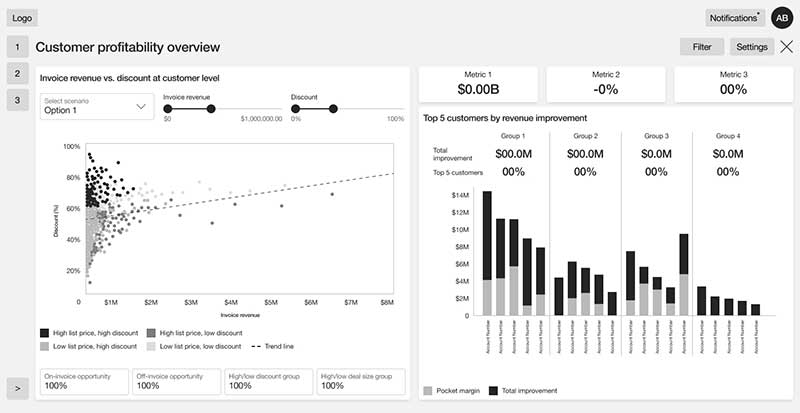
With opportunities identified, we sketched, iterated, and refined wireframes for each dashboard. Since users access the product through a secured VPN on laptop or desktop, those screen sizes were our focus.
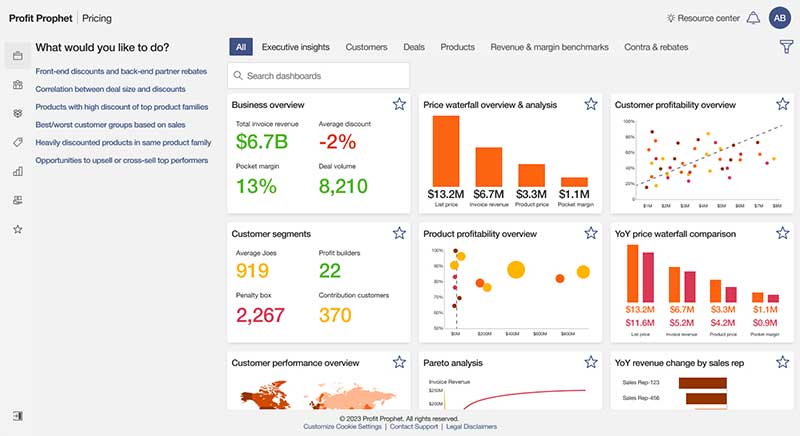
Main Dashboard
Price Waterfall
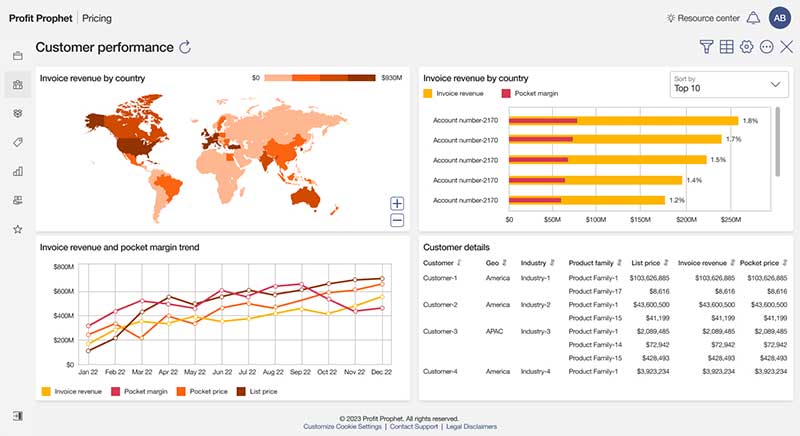
Customer Performance
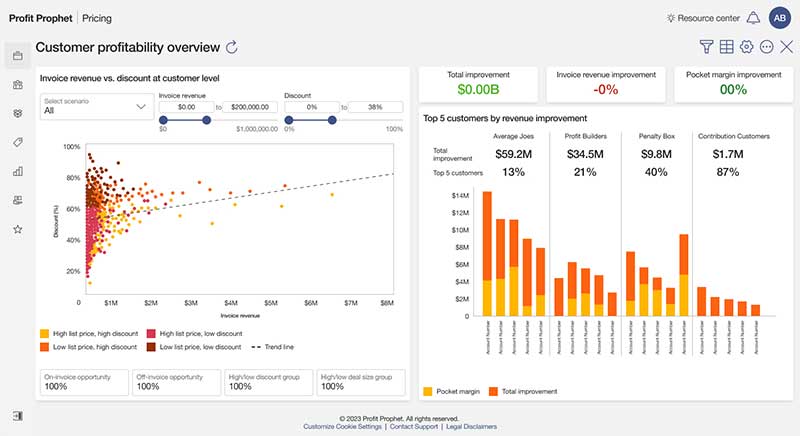
Customer Profitability
Low-Fidelity Prototype & Testing
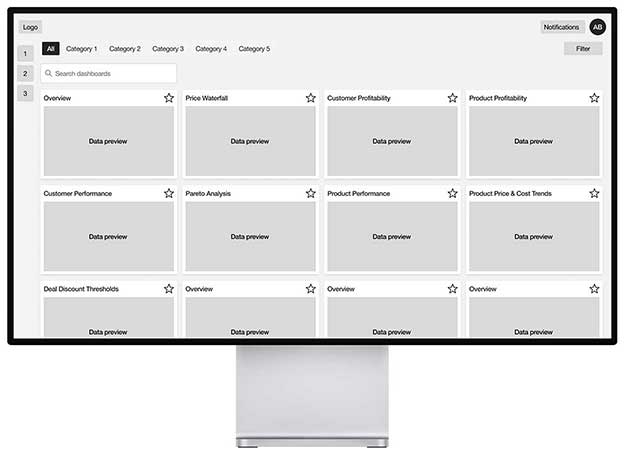
Observing users interacting with prospective designs is crucial to finding out whether the designs work in practice.
Summary
After assembling a lo-fi prototype to demonstrate a Pricing Lead’s journey to implement a price adjustment request, the team and I conducted several moderated live usability studies with stakeholders and subject matter experts fully versed in marketing and price adjustment.
Tasks
- Find a specific product
- Make hypothetical adjustments using the Price Waterfall dashboard to find an optimal price
- Use several supporting dashboards to confirm their price adjustment
Results
Based on moderated usability sessions with 8 participants via Microsoft Teams (~1 hour each), asking each to act as a Pricing Lead and use the low-fidelity prototype to complete a price adjustment request.
100% successfully completed the provided tasks
Checking the current price in the Price Waterfall chart, making an adjustment, and reviewing the results
100% called the dashboards and charts “very helpful”
Testers noted that “the data is clearly represented” and “useful data for making a price adjustment”
87.5% preferred our dashboards over their current tool
Several testers called it “better designed” and “more thought out” than what they use
75% found the homepage overwhelming —
“I don’t know where to start.”
Problem
Many users were overwhelmed by the amount of content
The platform had grown to 30+ dashboards, built up over hundreds of prior client engagements — powerful, but overwhelming for anyone encountering it for the first time. They didn’t know where to start a given task until they understood the dashboards.
Solution
Curate dashboards by role and create a Quick Start Menu
Work with stakeholders and subject matter experts to prioritize dashboards and find common actions for Pricing Leads, eliminating impractical options. Pricing Leads will have common, repetitive tasks to complete. Provide a prominent list of quick start options to reduce the burden of choosing a dashboard.
Before
The original opening screen offered every dashboard, overwhelming all users with options
After
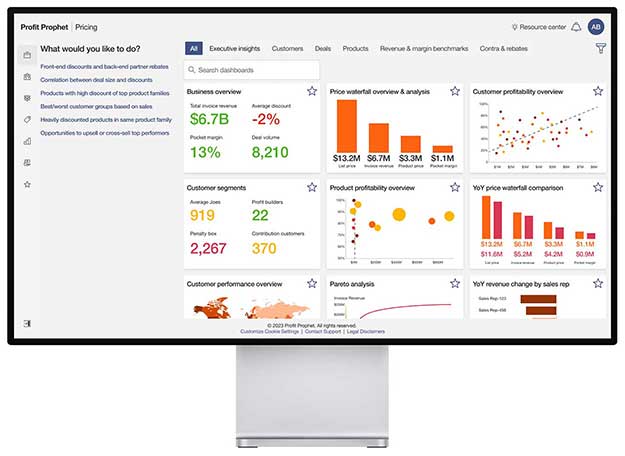
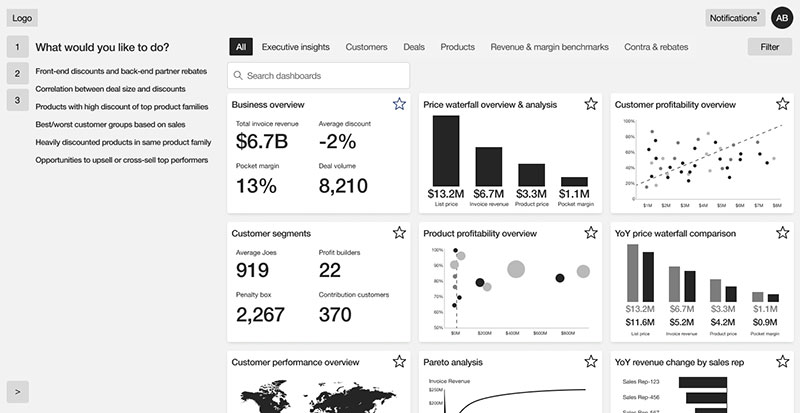 Now the opening screen has a Quick Start menu that lists common tasks alongside dashboards valuable to the user’s role
Retest and Validate Our New Solution
If testing is important, retesting is more important. We conducted another round of interviews and confirmed our solutions. They worked! All test users performed their provided tasks more efficiently and praised the design adjustments.
High-Fidelity Mockups
After validating our solutions with users, the next step was to finalize our dashboards and bring them to life.
Main Dashboard
Price Waterfall
Customer Performance
Customer Profitability
Final Prototype
The final step before handing off our designs to the development team was to take our high-fidelity mockups and create a working prototype. It anchored stakeholder presentations, helped us verify final details with testers, and gave developers a visual reference to build from.
Lessons Learned
1. “Too many options” is a real dilemma for users
The more options you provide to a user, the more complex the decision-making process becomes. Providing essential choices reduces confusion and allows users to complete tasks faster.
2. Guide the users
In addition to limiting the number of dashboard options, we provided the users with a Quick Start section to set them on the right path from the very beginning with common tasks.
3. Tailor the content
Through the testing and interview process we learned which charts suited each role best and used feedback to make them easier to use. Our robust Price Waterfall chart certainly turned some heads.