Risk Manager
Resolve compliance issues fast with AI-powered guidance through Process Risk and Controls.
Product, client, and persona names have been changed for confidentiality.
Risk hides in the details most teams don’t have time to check
The Story
To understand what to design, we illustrated a typical interaction between Priya, Process Risk Analyst, and Jonathan, Process Risk Manager.
Problem #1
Risk Scoring was confusing
The scoring system associated high scores with high risk, a negative indicator. This runs counter to most scoring systems where high scores are positive.
Solution #1
Replace Risk Scores with Confidence Scores
Higher scores are associated with positive results, so we changed the concept to higher scores indicating more confidence in that PRC.
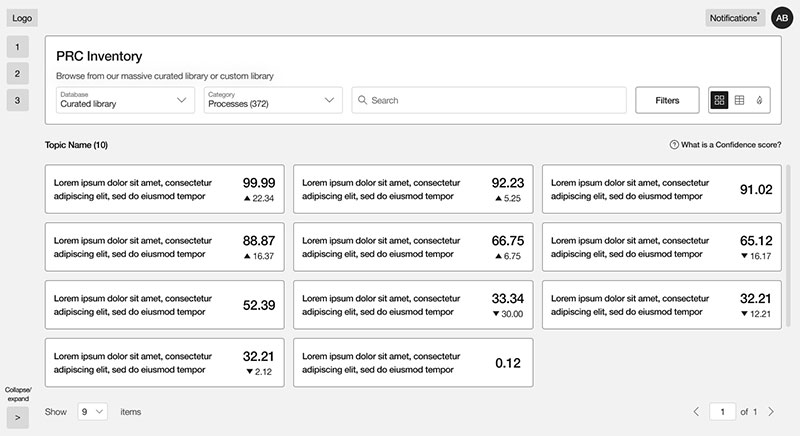 Confidence scores make sense when higher scores are positive.
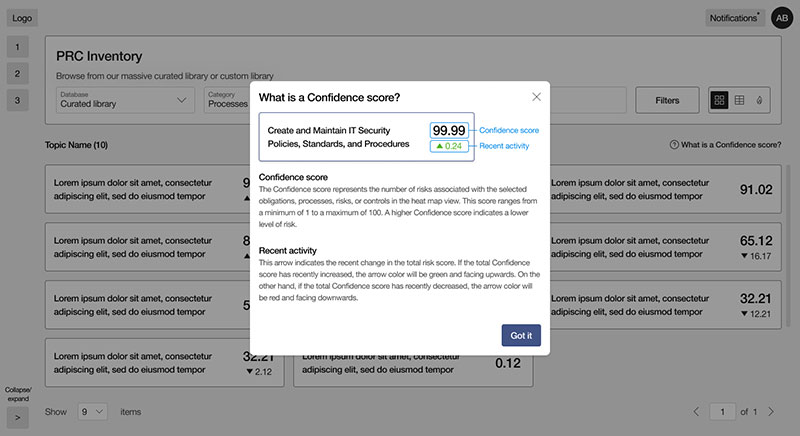 A modal was designed to explain the Confidence scoring system.
Final Prototype
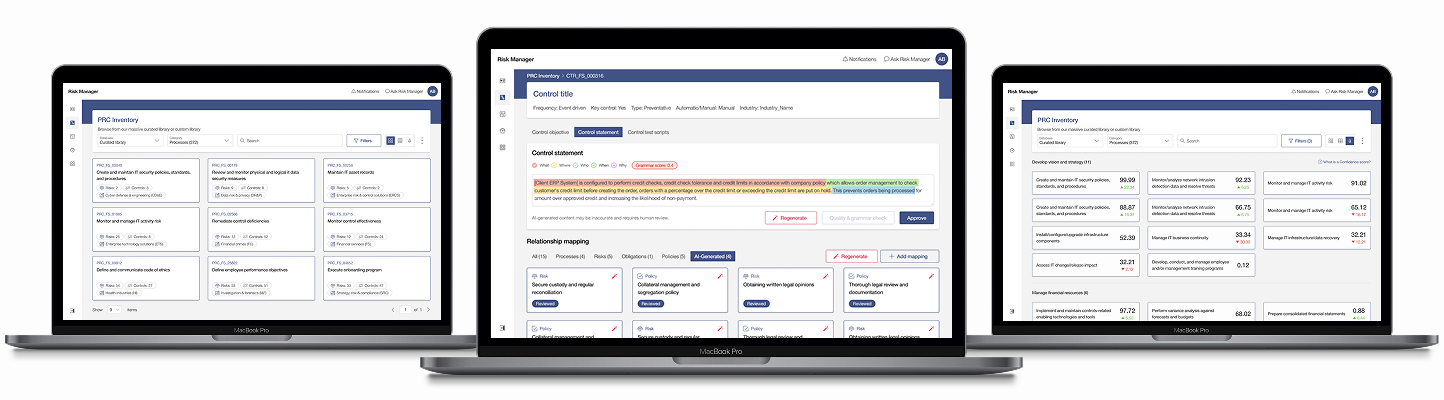
The final step before handing off our designs to the development team was to take our high-fidelity mockups and create a working prototype. It anchored stakeholder presentations, helped us verify final details with testers, and gave developers a visual reference to build from.
Lessons Learned
1. Match users’ expectations
Risk Scores ran backwards — a high score meant high risk, which felt wrong the moment users saw it. Renaming them Confidence Scores and flipping the scale so higher meant better resolved the confusion instantly, without any change to the underlying data.
2. Surface what matters first
Control Objective, Control Statement, and Control Test Script were the fields users needed most, but they were buried under lower-priority information. Reordering the page around these fields cut the time it took analysts to find what they needed.
3. Trim to the essentials, even for experts
Even experienced Process Risk Analysts were overwhelmed by cards and tables loaded with secondary data. Stripping each view down to only what’s essential — and simplifying the search to filter by category — made the interface faster to scan without sacrificing capability.