Risk Manager
Resolve compliance issues fast with AI-powered guidance through Process Risk and Controls.
Product, client, and persona names have been changed for confidentiality.
Risk hides in the details most teams don’t have time to check
The Research
Process
Empathy Map
 An empathy map helps us establish our personas by finding their voices, feelings, and motivations.
Empathy map of our target user, in four quadrants:
- Says
- “Attention to detail is the most important skill.”
- “There is a lot of repetition with slight variations that make an automated system hard to execute.”
- Thinks
- This job is impossible to do without a second pair of eyes supervising every detail.
- I wish there were a way to expedite the tedious parts of my job, so I can focus on more important details.
- Does
- Relies on basic tools to “get the job done.”
- Spends too much time double-checking every detail.
- Stresses over every detail.
- Feels
- Overwhelmed
- Stressed
- Like they should check everything again
User Pain Points
1. Attention to detail is required
Without high-level discipline and organizational skills, our users are at risk of underperforming, cost their organization, or lose their jobs.
2. Regulatory compliance
Industries like finance and healthcare face strict regulations that require rigorous risk management and control frameworks. Non-compliance could lead to significant penalties.
3. Continuous improvement
PRC frameworks need ongoing assessment and improvement, using audits to refine processes and controls.
Our Users
Priya, Process Risk Analyst

“My job is all about the details... and there are A LOT of them.”
Priya is responsible for identifying, assessing, and mitigating risks associated with business processes. Her primary focus is ensuring that processes are efficient, compliant, and capable of achieving organizational objectives while minimizing potential risks.
Goals
- Identify, assess, and mitigate risks
- Ensure company is compliant with all industry regulations
Frustrations
- Overwhelming amount of information
- It’s hard to identify possible relationships between PRCs
- One mistake could be very costly
- Navigating certain PRCs can be time-consuming and repetitive
Priya’s User Journey
Primary task: Modify a PRC and submit the change for approval.
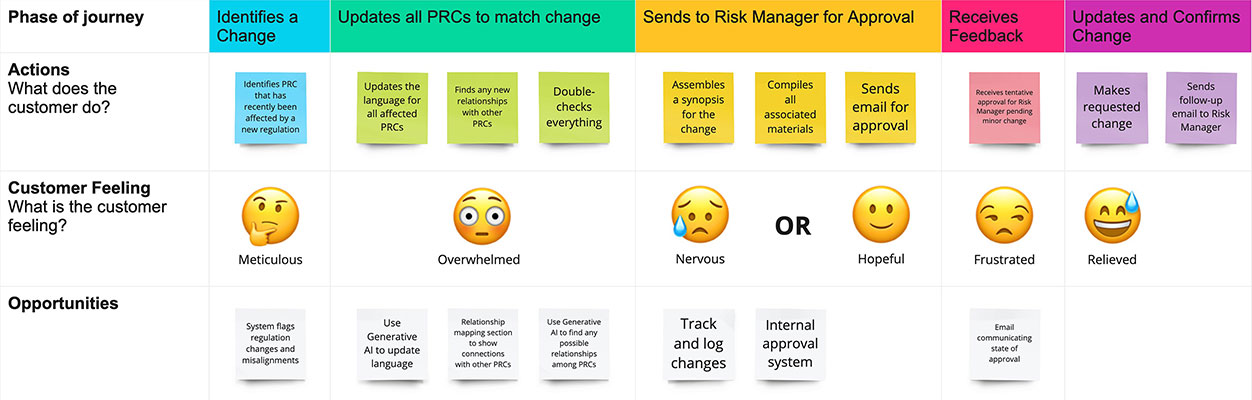
The journey has 5 phases. For each one: what the user does, how they feel, and the design opportunities it points to.
Phase 1: Identifies a Change
- Actions
- Identifies a PRC that has recently been affected by a new regulation
- Feeling
- Meticulous
- Opportunities
- System flags regulation changes and misalignments
Phase 2: Updates All PRCs to Match Change
- Actions
- Updates the language for all affected PRCs
- Finds any new relationships with other PRCs
- Double-checks everything
- Feeling
- Overwhelmed
- Opportunities
- Use generative AI to update language
- Relationship mapping section to show connections with other PRCs
- Use generative AI to find any possible relationships among PRCs
Phase 3: Sends to Risk Manager for Approval
- Actions
- Assembles a synopsis for the change
- Compiles all associated materials
- Sends email for approval
- Feeling
- Nervous or hopeful
- Opportunities
- Track and log changes
- Internal approval system
Phase 4: Receives Feedback
- Actions
- Receives tentative approval from the Risk Manager, pending a minor change
- Feeling
- Frustrated
- Opportunities
- Email communicating state of approval
Phase 5: Updates and Confirms Change
- Actions
- Makes requested change
- Sends follow-up email to Risk Manager
- Feeling
- Relieved
Jonathan, Process Risk Manager

“One overlooked detail can cost us. I make sure my team never has to guess.”
Jonathan manages a team of Process Risk Analysts, including Priya. An expert on Process Risk and Controls (PRC), he has used various tools, but always falls back on tried-and-true methods because of inaccuracies.
Goals
- Overseeing and approving PRCs submitted by his team
- Making sure his team is as efficient as humanly possible
Frustrations
- Relying on outdated and time-consuming tools
- The inevitability of human error
Jonathan’s User Journey
Primary task: Review and approve a PRC change submitted by a member of his team.
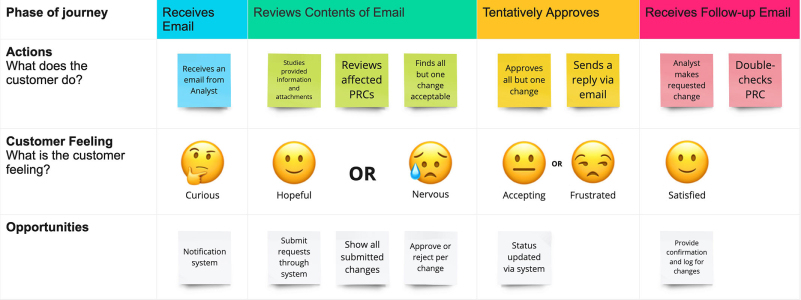
The journey has 4 phases. For each one: what the user does, how they feel, and the design opportunities it points to.
Phase 1: Receives Email
- Actions
- Receives an email from Analyst
- Feeling
- Curious
- Opportunities
- Notification system
Phase 2: Reviews Contents of Email
- Actions
- Studies provided information and attachments
- Reviews affected PRCs
- Finds all but one change acceptable
- Feeling
- Hopeful or nervous
- Opportunities
- Submit requests through system
- Show all submitted changes
- Approve or reject per change
Phase 3: Tentatively Approves
- Actions
- Approves all but one change
- Sends a reply via email
- Feeling
- Accepting or frustrated
- Opportunities
- Status updated via system
Phase 4: Receives Follow-up Email
- Actions
- Analyst makes requested change
- Double-checks PRC
- Feeling
- Satisfied
- Opportunities
- Provide confirmation and log for changes
The Story
To understand what to design, we illustrated a typical interaction between Priya, Process Risk Analyst, and Jonathan, Process Risk Manager.
Low-Fidelity Prototype & Testing
Observing users interacting with prospective designs is crucial to finding out whether the designs work in practice.
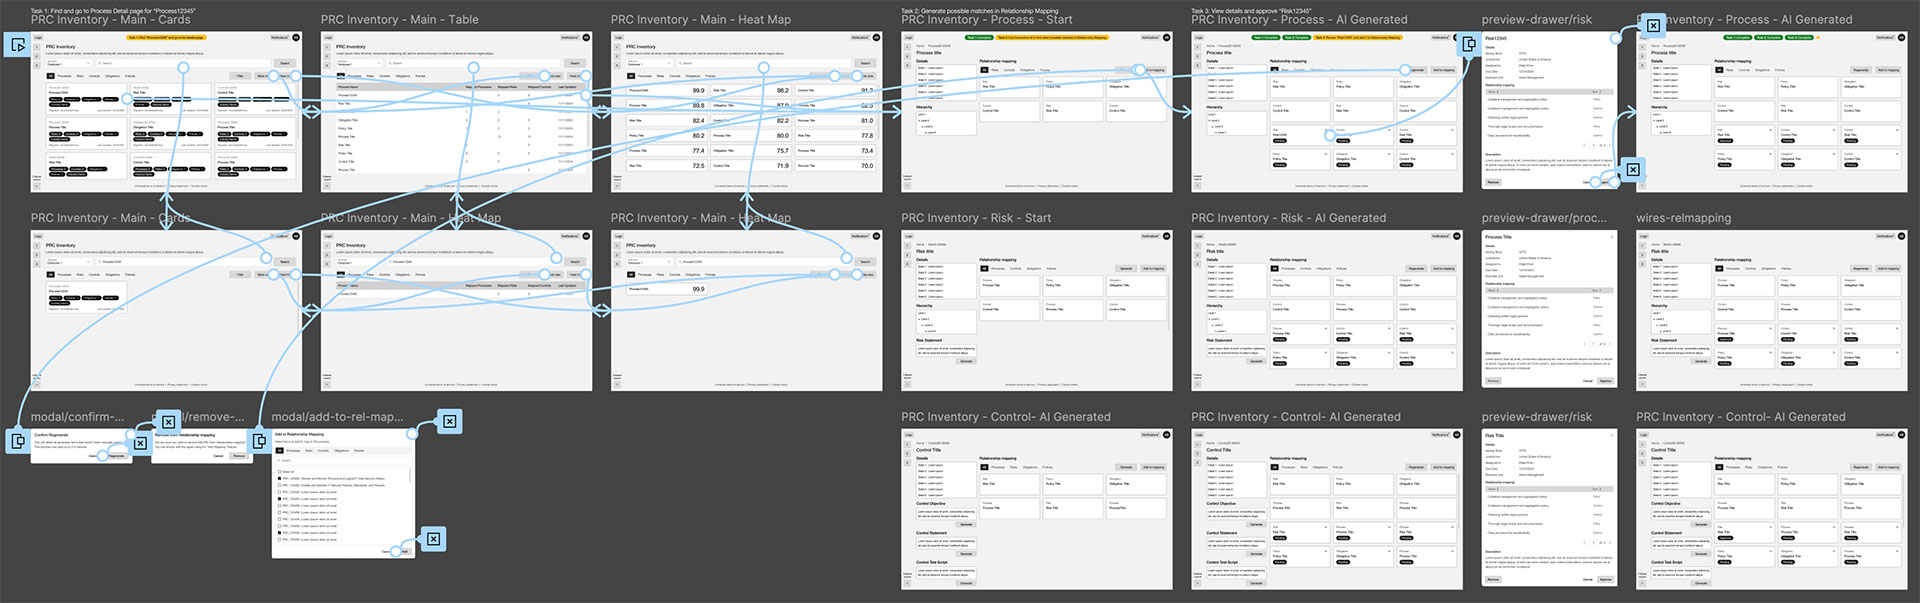
Summary
After assembling a lo-fi prototype to demonstrate a Process Risk Analyst’s journey to update a Control, the team and I conducted several moderated live usability studies with stakeholders and subject matter experts fully versed in Process Risk and Controls (PRC).
Tasks
- Find a Control
- Update the Control Objective, Control Statement, and Control Test Script
- Submit them for approval
Results
Based on moderated usability sessions with 10 participants via Microsoft Teams (~1 hour each), asking each to use the low-fidelity prototype to find a Control and update its Control Objective, Control Statement, and Control Test Script.
100% completed the task of changing a Control
All testers found the Control and updated its Control Objective, Control Statement, and Control Test Script, noting “the flow works”
100% were confused by the Risk Scoring
All testers assumed high Risk scores were a positive — “Oh, that’s bad?!”
80% wanted statements and objectives prioritized
Most testers thought important fields were “tucked away” or “off to the side”
70% said the cards displayed too much information
Most testers were deterred by information in cards — “I just need a short description, the number of Processes and Controls, and the industry name”
Retest and Validate Our New Solution
If testing is important, retesting is more important. We conducted another round of interviews and confirmed our solutions. They worked! All test users performed their provided tasks more efficiently and praised the design adjustments.
Lessons Learned
1. Match users’ expectations
Risk Scores ran backwards — a high score meant high risk, which felt wrong the moment users saw it. Renaming them Confidence Scores and flipping the scale so higher meant better resolved the confusion instantly, without any change to the underlying data.
2. Surface what matters first
Control Objective, Control Statement, and Control Test Script were the fields users needed most, but they were buried under lower-priority information. Reordering the page around these fields cut the time it took analysts to find what they needed.
3. Trim to the essentials, even for experts
Even experienced Process Risk Analysts were overwhelmed by cards and tables loaded with secondary data. Stripping each view down to only what’s essential — and simplifying the search to filter by category — made the interface faster to scan without sacrificing capability.